The Law of Demand (Click to download PDF handout)
 As the price of a good or service increases (from $1 to $3, for example), the quantity demanded of that good or service will decrease (from three units to one unit, for example). Conversely, as the price of a good or service decreases (from $3 to $1), the quantity demanded of that good or service will increase (from one unit to three units). There are two reasons that account for this. The first is that the higher price means the demander (consumer) must forgo other activity to consume (opportunity cost). The second is that the higher price means a higher level of satisfaction or utility is necessary before the demander (consumer) sees the exchange as acceptable (marginal benefit vs. marginal cost).
The Law of Supply (Click to download PDF handout)
 As the price of a good or service increases (from $1 to $3, for example), the quantity provided of that good or service will also increase (from one unit to three units, for example). Conversely, as the price of a good or service decreases (from $3 to $1), the quantity provided of that good or service will also decrease (from three units to one unit). There are two reasons that account for this. The first is that the higher price provides a greater incentive to the producer to forgo other activity (opportunity cost), thereby increasing effort. The second is that the higher price allows for less productive resources to be used while still maintaining an acceptable return (marginal benefit vs. marginal cost).
Production Possibility (Click to download PDF handout)
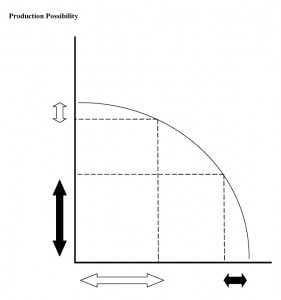
 The purpose of the production possibility curve, sometimes known as a production possibility frontier, is to illustrate a tradeoff in production faced by a nation, firm or person. The curved line is meant to represent all the efficient production combinations given a set of resources available. Points inside the curve represent inefficient use of resources (waste) and points outside the curve represent production combinations that are impossible, given the resources available. Generally, points near the middle of the curve represent the most efficient use of resources. This is because units of production gained are similar in quantity to the units of production lost as you move up and down the curve. However, near the ends of the curve – the sections closest to either axis – the trade-offs change. Movement along the curve toward the center has a larger gain in one outcome for a small loss in the other. Likewise, movement toward the axis means incurring a large loss for a relatively small gain. The correspondingly-colored arrows along the two axes are a graphic illustration of the corresponding tradeoffs.
Equilibrium Price (Click to download PDF handout)
 The equilibrium or market price is the price where the supplier’s quantity supplied and the demander’s quantity demanded are equal, and the market “clears.” Quantity supplied equals quantity demanded at the market price. (At a price of $2.50, two units are supplied and two units are demanded. Both the producer and consumer are satisfied. There are no shortages and no surplus.)
Elasticity of Demand — Elastic Demand (Click to download PDF handout)
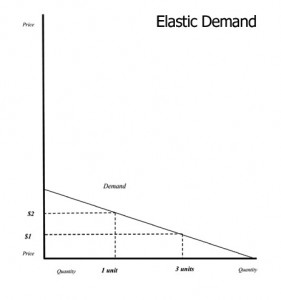
 Elasticity refers to a consumer’s responsiveness to changes in price. When people are dealing with a product or service they perceive as a luxury or something that’s “nice to have;” we say that product has elastic demand. This means that a relatively small change in the price of the good or service will result in significant changes in the quantity demanded. For example, if we have a product or service that is priced at $2 per unit, and we observe that a price cut of 50% results in three times as much of the product being consumed (3 units sold when the price is cut to $1), we would say that product has relatively elastic demand. It would also be true if we had a product that sold 3 units at a price of $1 each, but when we doubled the price, we sold only 1/3 as many units. Products that are relatively elastic generally are luxury goods, or goods that are perceived by consumers to have relatively lower marginal utility or value.
Elasticity of Demand — Inelastic Demand (Click to download PDF handout)
 Elasticity refers to a consumer’s responsiveness to changes in price. When people are dealing with a product or service they feel they absolutely must have, we say they have inelastic demand. This means that a change in the price of the good or service will result in relatively small (or no) changes in the quantity demanded. For example, the product with a price of $1 results in 2 units demanded. If the price of product is raised to $10 per unit; the quantity demanded falls to 1 unit. Likewise, a drop in price of the product from $10 per unit to $1 per unit only results in additional demand of one unit. Products that are relatively inelastic generally are necessities or staples (gasoline, bread, milk), or goods that are perceived by consumers to have relatively high value or to have few substitutes. This is frequently also a characteristic of goods that are addictive (tobacco, drugs, etc.).